-
-

- Login
- Find Distributor


-
 Home
Home
-
- Applications
-
- Dairy
-
- Cost of Delay – ROI Model
Application Detail
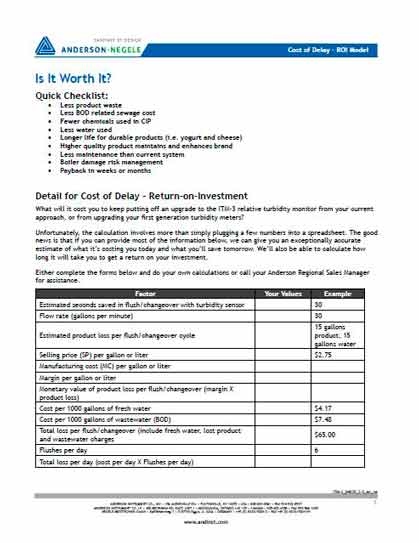
Is It Worth It?
Quick Checklist:
Sewer Surcharges
- Less product waste
- Less BOD related sewage cost
- Fewer chemicals used in CIP
- Less water used
- Longer life for durable products (i.e. yogurt and cheese)
- Higher quality product maintains and enhances brand
- Less maintenance than current system
- Boiler damage risk management
- Payback in weeks or months
| Factor | Your Values | Example |
| Estimated seconds saved in flush/changeover with turbidity sensor | 30 | |
| Flow rate (gallons per minute) | 30 | |
| Estimated product loss per flush/changeover cycle | 15 gallons product, 15 gallons water | |
| Selling price (SP) per gallon or liter | $2.75 | |
| Manufacturing cost (MC) per gallon or liter | ||
| Margin per gallon or liter | ||
| Monetary value of product loss per flush/changeover (margin X product loss) | ||
| Cost per 1000 gallons of fresh water | $4.17 | |
| Cost per 1000 gallons of wastewater (BOD) | $7.48 | |
| Total loss per flush/changeover (include fresh water, lost product and wastewater charges | $65.00 | |
| Flushes per day | 6 | |
| Total loss per day (cost per day X Flushes per day) | ||
| Investment cost for ITM-3 including assembly: (equipment price approximately $2,500 US plus assembly costs) | ||
| Amortization achieved after X phase changes (=investment costs/monetary value loss per phase cycle) | ||
| Number of phase changes per week in your plant | ||
| Amount of time in weeks (=number of phase changes up to amortization/number of phase changes per week) | ||
| Savings with an assumed life service duration of 5 years (260 weeks) = (260 week – amortization time) X phase change per week X monetary value loss per phase change |
| Factor | Your Values | Example |
| Current and target waste load in pounds of BOD5 per thousand pounds of milk processed | ||
| Daily production in thousands of pounds of milk | ||
| Multiply current and target waste loads by daily production to find daily waste load in pounds | ||
| Enter your BOD5 surcharge cost per pound | ||
| Multiply the daily waste load by the surcharge cost to find your daily surcharge cost | ||
| Enter the number of days your plant operates each year | ||
| Multiply the daily surcharge cost by the number of days your plant operates annually to find the annual surcharge cost | ||
| Subtract the annual surcharge cost for the target waste load from the annual cost for the current waste load to find your annual savings |
Copyright © 2022 Anderson-Negele